DSR+
What is the DSR+? 
The DSR+ is a score out of 100 for the ratio of demand to supply for a property market. The higher the DSR+, the more demand exceeds supply.
The DSR+ is version 2 of the Demand to Supply Ratio. It is a more advanced algorithm than the basic DSR. The DSR+ combines all statistics on the website into a single score.
The DSR+ is the best overall indicator of investment potential for a property market.
The DSR+ makes choosing where to buy easy. You do not need to assess all the other metrics because the DSR+ considers them all. It combines them all intelligently into a single score out of 100.
See the detail about why supply and demand are crucial for predicting capital growth potential in the page dedicated to explaining the standard DSR. That page explains everything DSR related including:
- Whether the DSR really works
- Common objections about what the DSR indicates
- Its reliability
- How it is calculated
- How to use it
- How it's built
- Source of the base data
DSR versus DSR+
The following chart shows a small portion of the early battle between the DSR and the DSR+ for predicting capital growth.
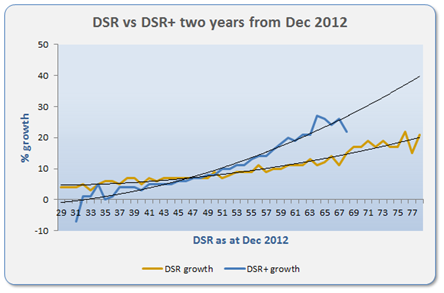
The chart shows the relationship to capital growth is even clearer with DSR+ than with DSR.
The DSR+ includes more than double the statistics of the basic DSR. And more are added each year, improving its reliability at picking growth markets.
Bad markets are more clearly identified by the DSR+ because of the larger number of stats used in its calculation. The DSR+ also finds good markets more accurately.
Note that the upper and lower ranges of the curves show greater volatility. This is because there are fewer markets in the sample. These types of markets are abnormal and therefore uncommon.
The DSR+ used in the above chart was in its infancy in Dec 2012. More goes into the calculation of the DSR+ now days. So you can expect the accuracy to be even greater.
Note that the DSR+ is a privileged indicator and is not available to all members. See pricing for details.
What is a good DSR+ score?
If a suburb has a DSR+ of 50, it means that supply and demand are in balance. The majority of property markets for 2014 had a DSR+ between about 50 and 60. These markets are likely to grow at the same rate as the long term national average.
About 0.8% of property markets in January 2015 had a DSR+ of 67 or higher. These markets are highly desired by investors looking for quick strong capital growth.
The DSR+ for the very top market can sometimes be as high as 80. The following graphic places the DSR+ for Houses in South Brighton SA 5048 in context with the rest of the country's DSR+ scores.
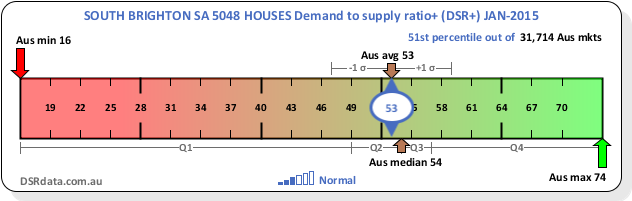
The chart shows that for January 2015 the maximum DSR+ was 74 country-wide and the minimum was 16. Anywhere above 55 would be better than most.
A high score for the DSR+ is tougher to achieve than a high score for the standard DSR. This is simply because there are more statistics considered and it therefore takes a truly great market to score highly in across the board in all stats.
The chart above is called a "context ruler" because it places a statistic in context along a ruler. You can get a full understanding of how to read the context ruler here.
Some of the worst property markets to invest in have DSR+ scores in the low twenties. These are locations of adverse economic conditions or crazy developer oversupply. These markets should be avoided if you're looking for strong capital growth in the next couple of years.
Base data sources
Some of the sources used for the data include: